Nuclear Theory archive — page 6
You Don't Pick a Cleanup Hitter on Batting Average Alone — How to Read Nuclear Plant Performance Indicators
From 1990 to 2015 the world median unit capability factor rose from 77.2% to 87.7% while scrams fell from 1.80 to 0.51 per 7,000 hours, yet a single plant can post its best capability year and its worst scram year at once.
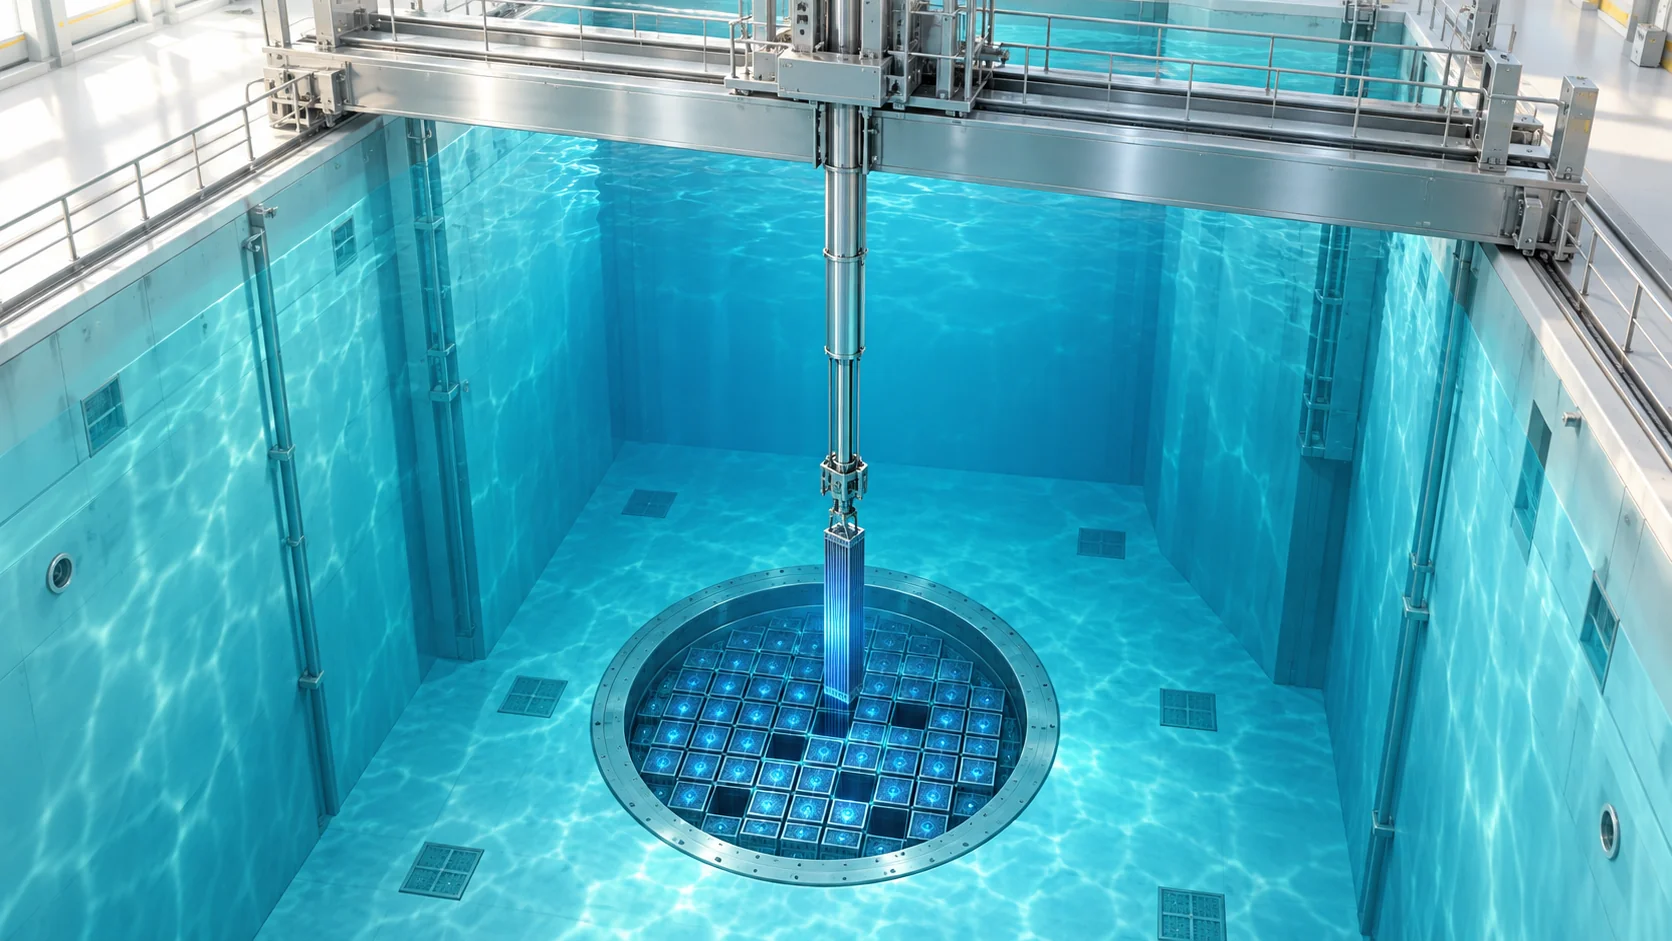
Nuclear Plants Get School Holidays Too — The Planned Maintenance Outage Every 18 Months
Every 18 months or so a PWR shuts down for about two months to replace about a third of its fuel under at least 7 m of borated water and complete inspections, with the critical path deciding when it restarts.
The Laundromat Washer's Report Card — How to Read a Nuclear Plant's Capacity Factor
A hypothetical 1,000 MW plant that loses 44.3 full-power days to a trip, a grid cut, coastdown and a refueling outage ends the year at 87.9%, and US nuclear plants averaged 90.8% in 2024, about 21.8 full-power hours a day.
The Hum in a Recording Knows What Time It Is — Grid Frequency Control and Nuclear Power
Using Britain's 9 August 2019 event and the droop rule (a 0.2 Hz drop calls for about 67 MW from a 1,000 MW unit at 5% droop), this explainer shows how grids hold frequency and why nuclear participation differs by country.

When the Sun Rises Over the Tetris Well — The Duck Curve and How Nuclear and Renewables Share a Grid
On 13 April 2025 California's net load fell to about −5.2 GW at noon and climbed about 28 GW by 8 p.m., while batteries, hydro, gas and imports covered the swing and nuclear held steady at about 1.1 GW.
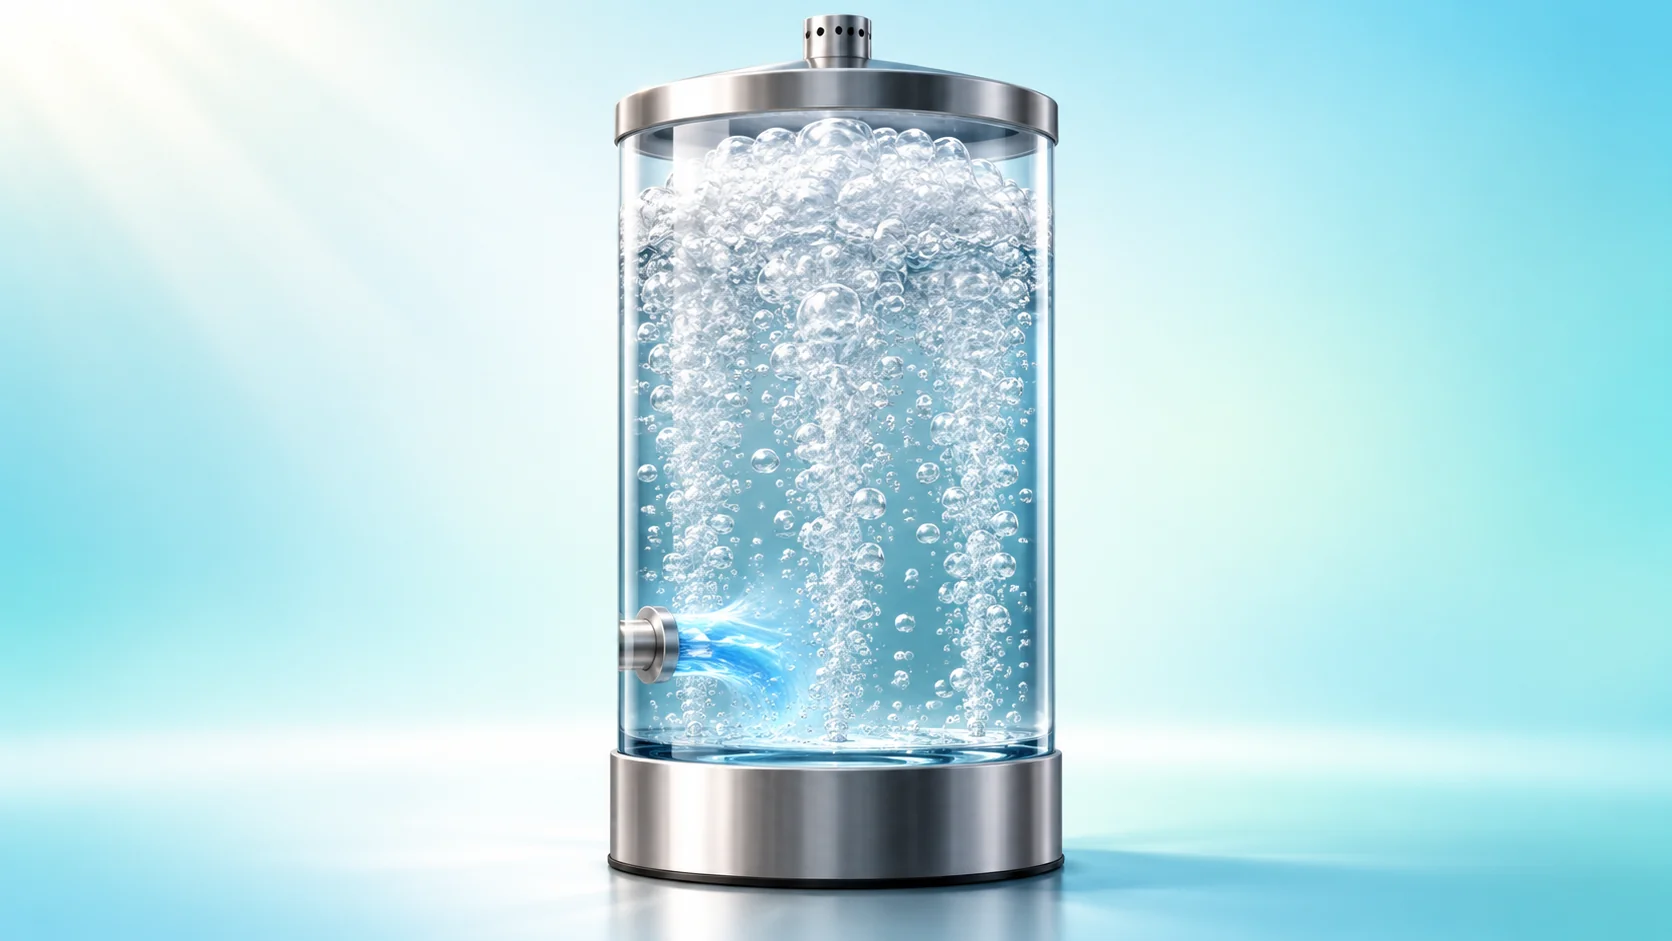
A Level That Fizzes Up Like an Opened Soda — Why Feedwater Control Is So Tricky
Shrink and swell make steam generator level move opposite to the water inventory at first, and at 5% power the swing reaches about 34 mm and lasts 2 minutes 40 seconds, which is why level trips once clustered below 20% power.
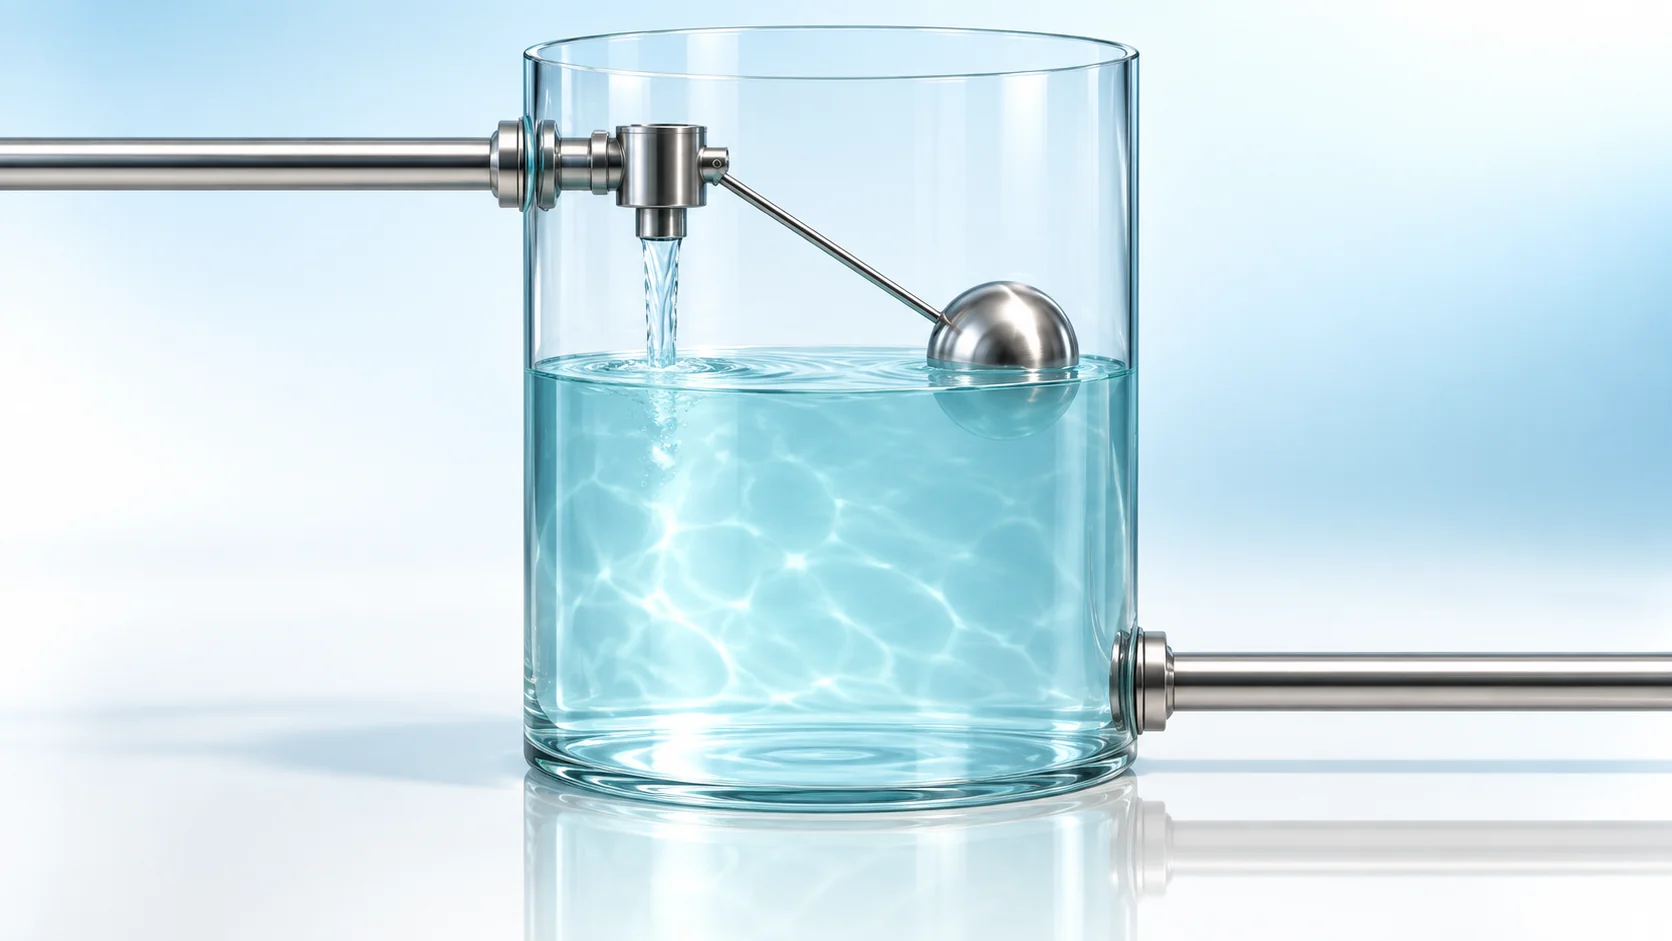
A Toilet-Tank Float Won't Cut It — The Three Eyes of Steam Generator Level Control
Steam generator level control feeds in as much water as leaves as steam, using steam flow, feedwater flow and level together to track a 33-to-44% level program, while separate trips act at 78% and 21%.
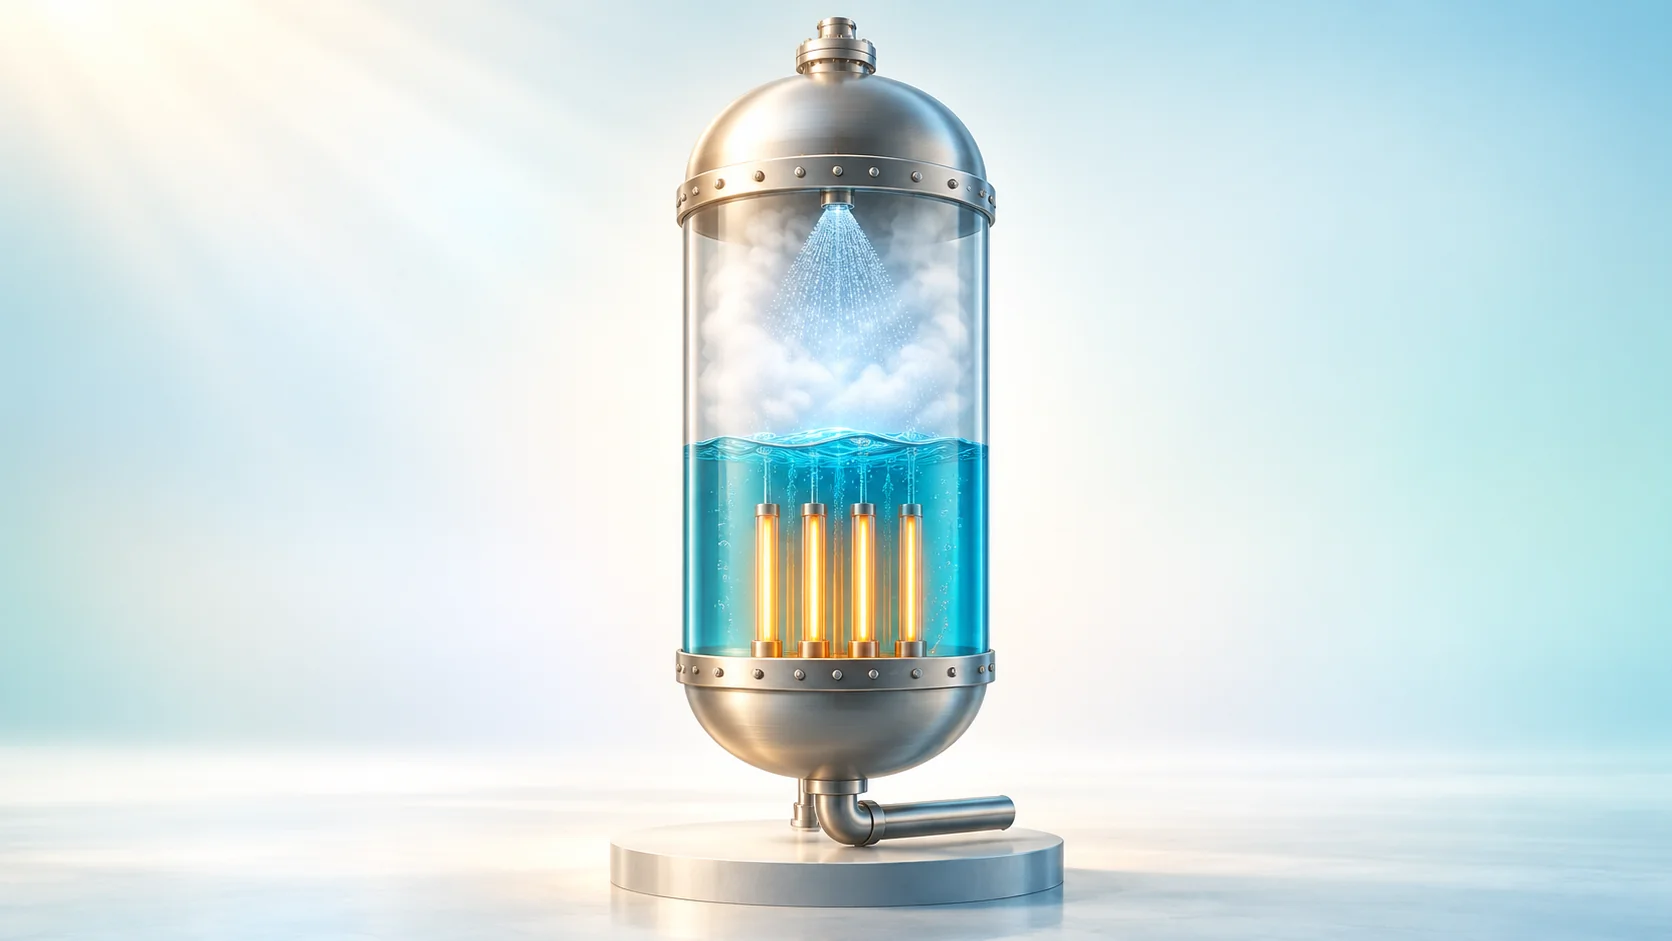
Squeeze So It Won't Boil, Release So It Won't Burst — Pressure Control in a Nuclear Plant
A pressurizer's steam cushion, heaters and spray hold a PWR's primary pressure near 15.5 MPa, keeping 324 °C water about 21 °C below boiling while relief valves, trips and safety valves guard the limits.
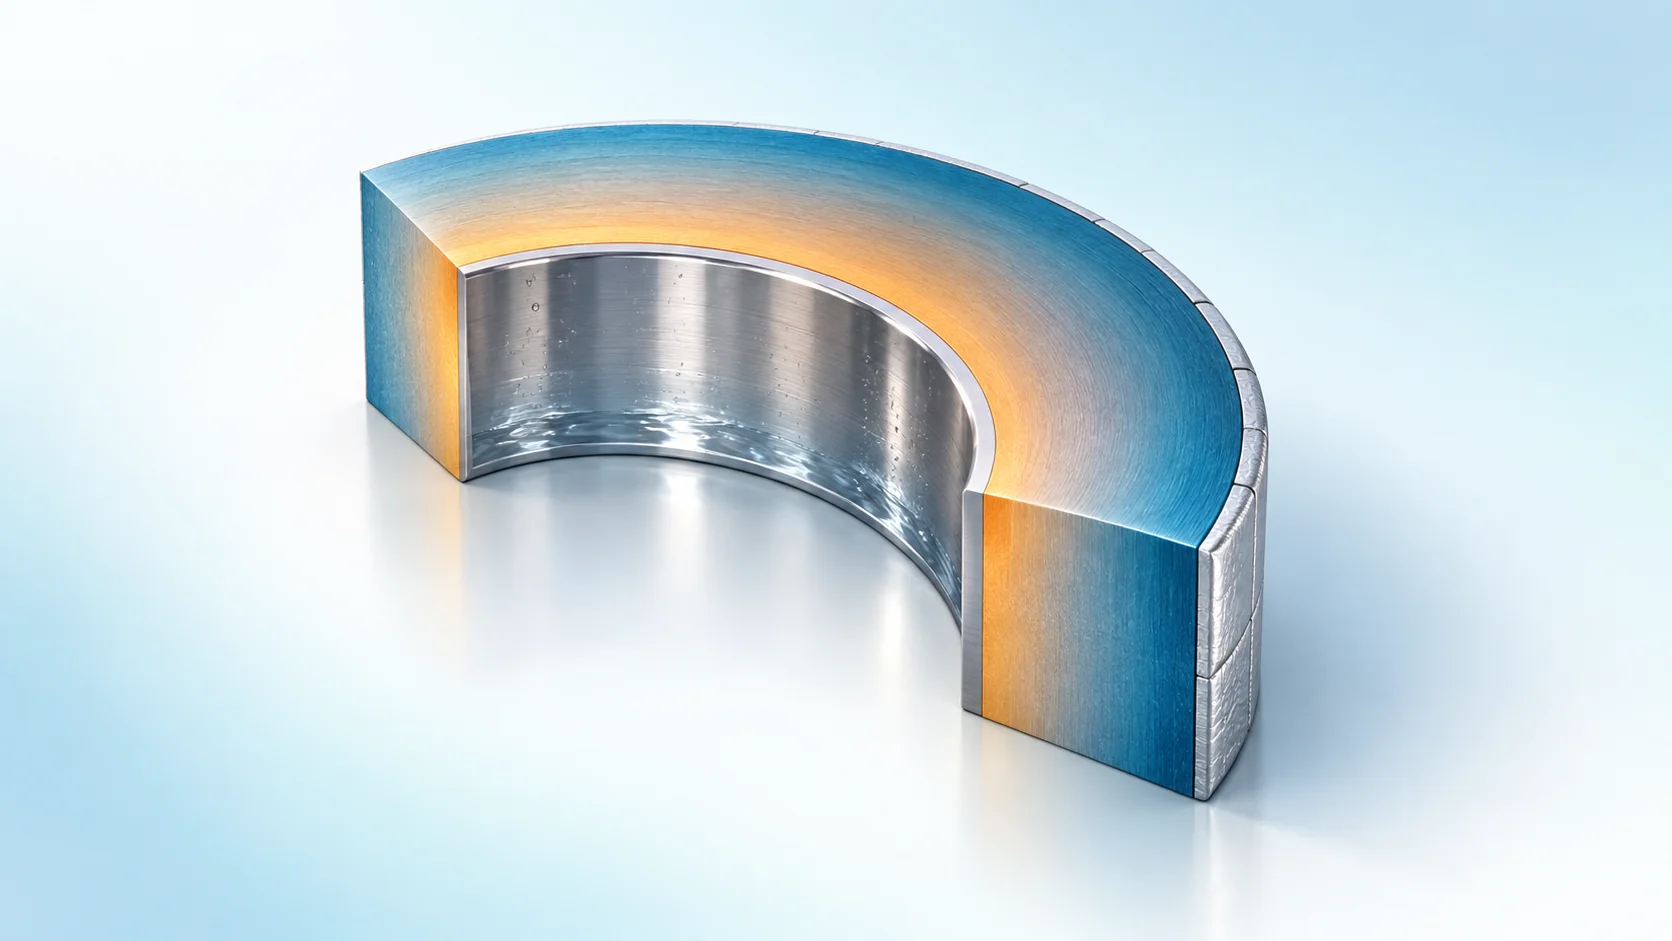
Why Ice Cracks in Your Drink — Thermal Stress and Why Reactors Must Heat Up Slowly
Heating a 22 cm reactor vessel wall at 55.6 °C per hour leaves the inside about 37 °C ahead of the outside, so plants cap heat-up and cool-down rates to keep thermal stress, pressure stress, brittleness and fatigue within design margins.
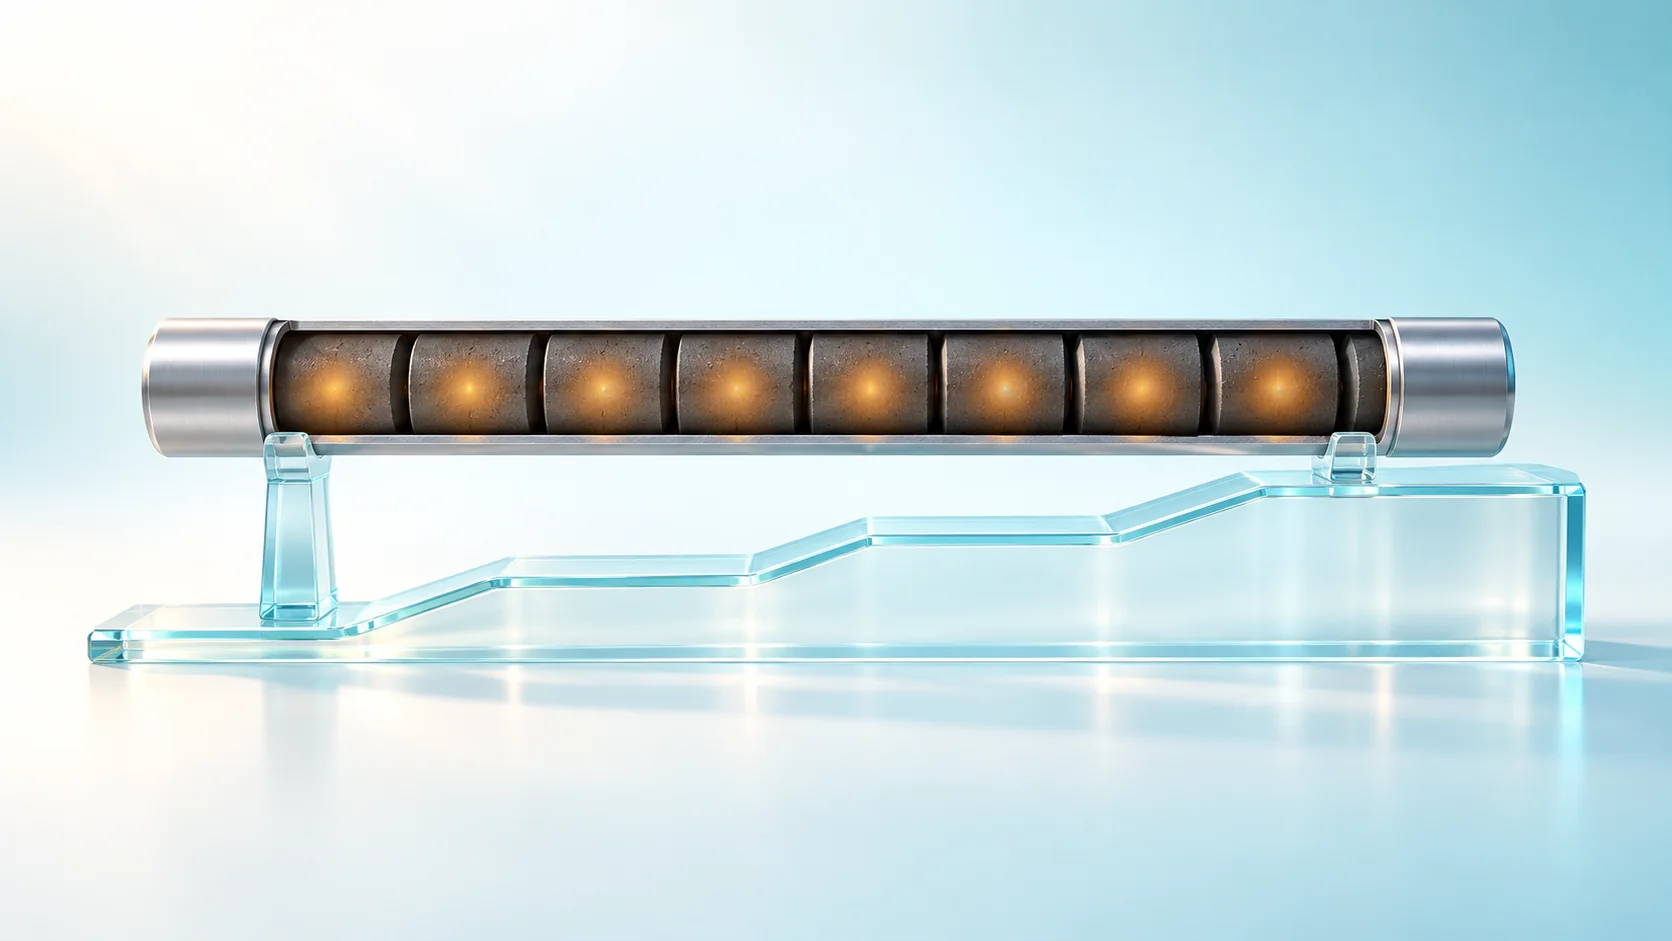
Break In Your New Shoes First — Why Nuclear Plants Limit Their Power Ramp Rate
Above a threshold after refueling, plants raise power by only about 3 to 4% of rated power per hour so that creep can relax the cladding before swelling pellets and iodine cause stress corrosion cracking.