Operation, Regulation & Quality · C-OP-009
Capacity Factor and Operating Factor — A Ratio of Energy and a Ratio of Time
Why the same year can read 86.9 % or 89.0 %: which losses each indicator subtracts, and why a quoted value must name the indicator and its denominator first.
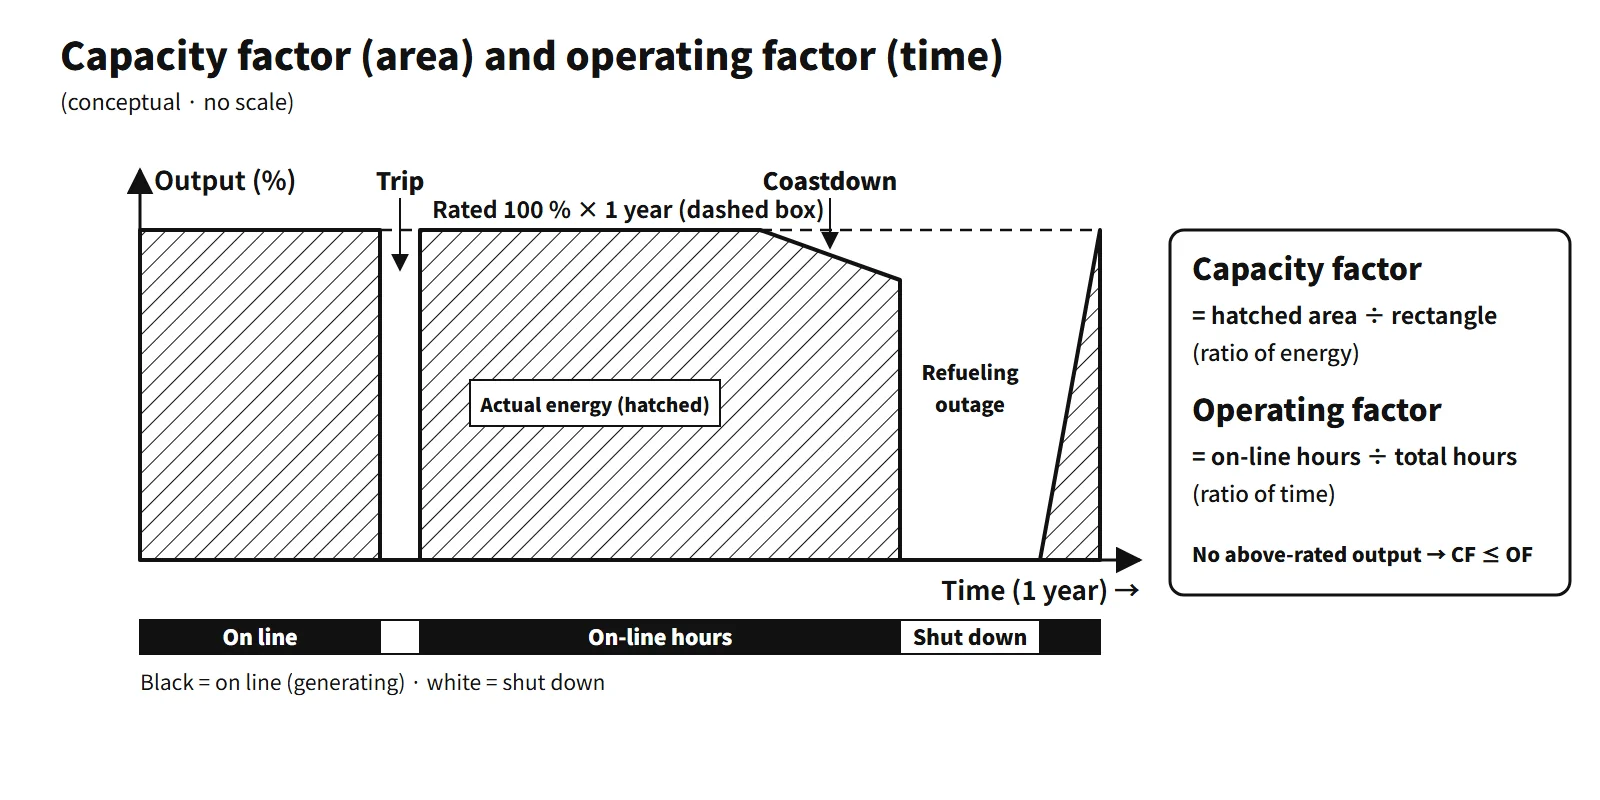
The capacity factor is the actual energy generated over a period divided by the energy that would have been generated at rated output for the whole period; the operating factor (time-based availability) is the share of the period's clock hours during which the generator was connected to the grid and generating. The capacity factor is a ratio of energy; the operating factor is a ratio of time.
- Capacity factor = energy generated (MWh) / [rated output (MW) × period (h)] × 100 %
- Operating factor = generating hours (h) / clock hours in the period (h) × 100 %
Principle and mechanism
The international indicator set
IAEA PRIS and WANO take the reference energy generation REG (energy at rated output for the whole period) as the denominator and split the losses by cause.
| Indicator | Equation | Losses subtracted |
|---|---|---|
| Capacity factor (PRIS name: load factor) | EG/REG | All losses + demand reductions |
| Energy availability factor EAF | (REG − PEL − UEL − XEL)/REG | Planned, unplanned, external |
| Unit capability factor UCF | (REG − PEL − UEL)/REG | Losses within management control |
| Unplanned capability loss factor UCLF | UEL/REG | — |
| Forced loss rate FLR | FEL/(REG − PEL − OEL) | — |
| Operating factor (PRIS OF) | Hours on line / clock hours | Time only |
PEL is the energy lost to shutdowns and power reductions planned at least four weeks in advance; UEL is the loss within management control from unplanned shutdowns, outage extensions and power reductions; XEL is the loss from reduced availability due to factors outside management control. IAEA PRIS coding also classifies end-of-cycle coastdown as XEL. FEL is the forced-outage loss and OEL the loss from unplanned extension of planned outages. Load following — lowering output on demand or dispatch instructions while the unit is available — is not an availability loss, so it lowers only the capacity factor.
Why they differ
Without operation above rating, capacity factor ≤ operating factor and capacity factor ≤ EAF ≤ UCF. Even while connected to the grid, the unit delivers less than rated energy because of the items below. The order between availability and operating factor is not fixed: if there is reserve shutdown (available but not dispatched), availability can be larger.
- Startup and power ascension after maintenance
- End-of-cycle coastdown: as burnup reduces the reactivity margin, rated power can no longer be held and output falls gradually
- Load following and output limits requested by the grid
- Power reductions due to equipment faults
Conversely, the capacity factor can exceed the operating factor when net output rises above rating in winter with cold cooling water, or when the rating and installed-capacity bases differ.
Worked example (assumed)
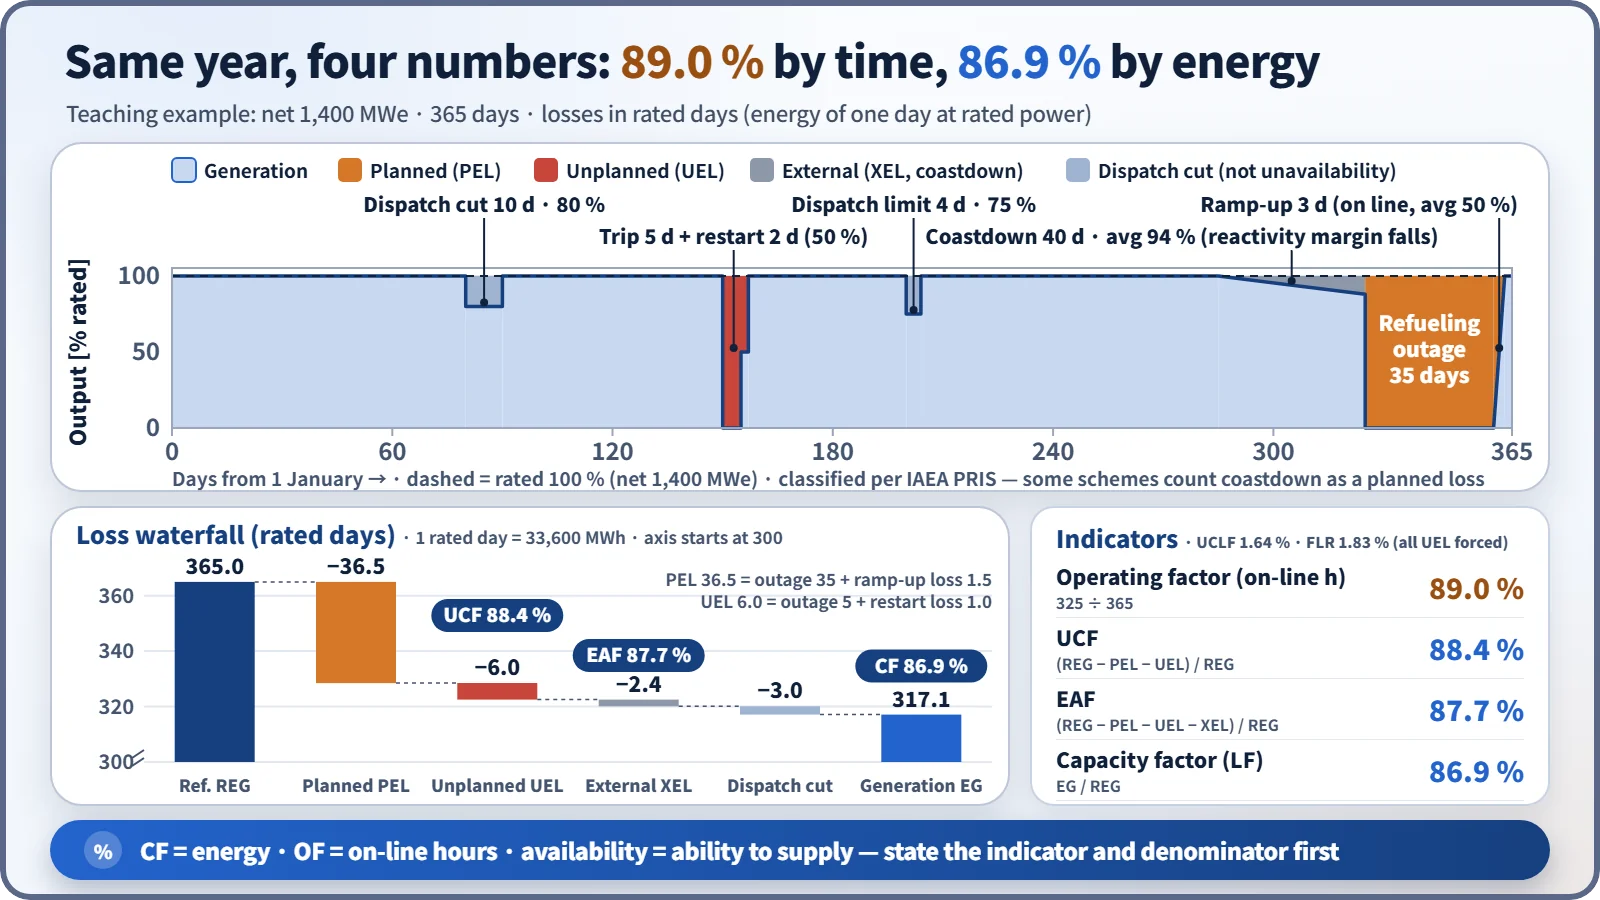
Assume an APR1400-class unit with net output 1,400 MWe over one year (REG = 365 rated days).
| Event | Duration and output | Loss (rated days) | Classification |
|---|---|---|---|
| Refueling and planned outage | 35 days, 0 % | 35.0 | PEL |
| Power ascension after the outage | 3 days, average 50 % | 1.5 | PEL |
| Unplanned trip + restart | 5 days at 0 % + 2 days at 50 % | 6.0 | UEL (forced) |
| End-of-cycle coastdown | 40 days, average 94 % | 2.4 | XEL (PRIS) |
| Output reduced on dispatch instruction | 10 days at 80 % + 4 days at 75 % | 3.0 | Not an availability loss |
- Energy generated EG = 365 − 36.5 − 6.0 − 2.4 − 3.0 = 317.1 rated days ≈ 10.65 TWh
- Capacity factor = 317.1/365 = 86.9 %
- EAF = 320.1/365 = 87.7 %, UCF = 322.5/365 = 88.4 %
- Operating factor (hours on line) = (365 − 35 − 5)/365 = 89.0 %
- UCLF = 6.0/365 = 1.64 %, FLR = 6.0/(365 − 36.5) = 1.83 % (all UEL forced, no outage extension), time-based forced outage rate FOR = 5/(5 + 325) = 1.52 %
The same year gives indicators ranging from 86.9 to 89.0 %. Under a scheme that counts coastdown as a planned loss, UCF becomes 87.7 %. When quoting a value, first state which indicator and which denominator is used.
Further worked examples: checking the data
- 1,000 MWe unit, 355,000 MWd in a year, outages of 7 and 23 days: capacity factor = 355,000/(1,000 × 365) = 97.3 %, operating factor = (365 − 7 − 23)/365 = 91.8 %. A check shows the maximum energy from 335 days at rated power is 335,000 MWd, so the average output while operating would have to be 106 % of rating. Compute by the definitions and note the inconsistency in the data.
- 1,350 MWe unit, 450,000 MWd in a year, 330 days on line: capacity factor = 450,000/(1,350 × 365) = 91.3 %, operating factor = 330/365 = 90.4 %. If the unit "ran at rated power while operating," energy would be 445,500 MWd and capacity factor = operating factor = 90.4 %. That differs from the given energy by about 3.3 rated days, so report both values.
What it means in a plant
Operating cycle and outage length
Considering outages only, the long-term operating factor is approximately 1 − D/(30.44T) (T cycle length in months, D outage days). An 18-month cycle with a 40-day outage gives 92.7 %; a 12-month cycle with 30 days gives 91.8 %. In-service inspections and periodic tests are also mainly done during these outages. In the US the average refueling outage was about 34 days (as of end of July 2024, EIA), and capacity factors have been about 90 % or more since the 2010s.
Link to economics
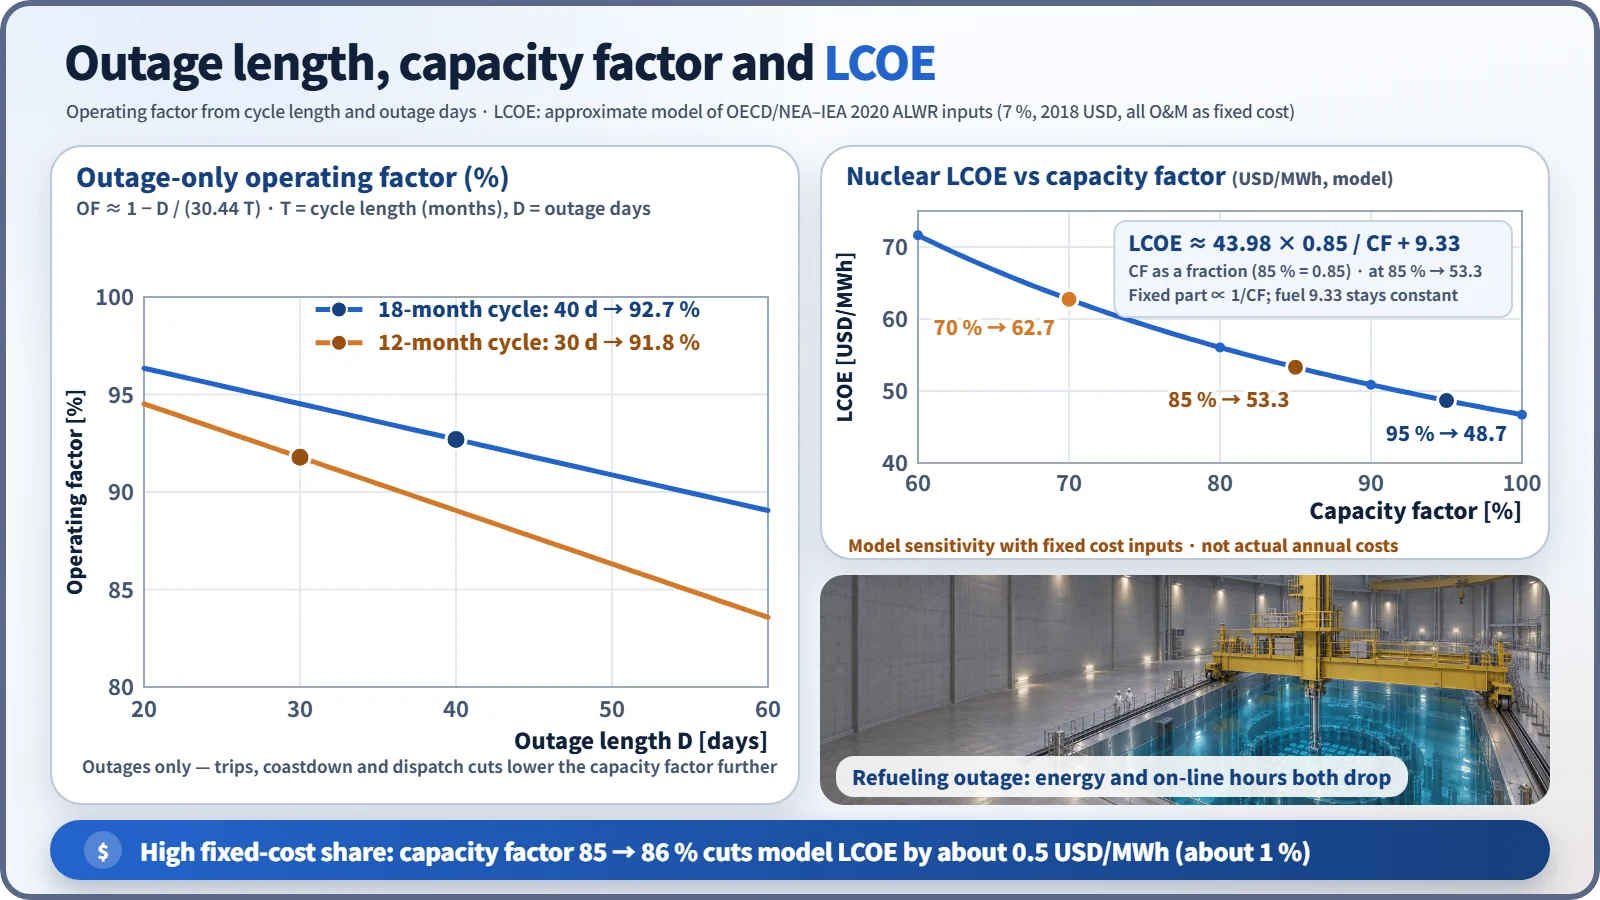
When grid-driven output limits increase (for example in light-load seasons), the capacity factor falls even though availability is unchanged.
Nuclear power has a large fixed-cost share, so the fixed part of the unit cost is inversely proportional to the capacity factor. In the model, LCOE is 62.7 at 70 %, 53.3 at 85 % and 48.7 USD/MWh at 95 %. Raising the capacity factor by 1 percentage point from 85 % lowers it by about 0.5 USD/MWh (about 1 %). This is a sensitivity with fixed cost inputs, not an actual annual cost.
How to improve it
- Reduce planned losses: longer cycles, critical-path management of outages, more on-line maintenance and on-line inspection (within what the Technical Specifications allow)
- Reduce unplanned losses: better reliability of trip-prone equipment (feedwater, turbine, electrical systems), condition-based maintenance, human-error prevention, the Maintenance Rule
- Output side: power uprates, optimized end-of-cycle coastdown, removing transmission constraints
- Safety comes first: shortening outages does not mean skipping necessary inspections.
Regulatory and indicator criteria
- Capacity and operating factors are not safety regulatory requirements but operational performance indicators. They are defined by the IAEA PRIS performance indicators and the WANO Performance Indicators (UCF, UCLF, FLR).
- Regulators monitor the frequency of unplanned scrams as a safety performance indicator (for example, the US NRC ROP indicator "unplanned scrams per 7,000 critical hours").
Easily confused pairs
| Capacity factor | Operating factor | |
|---|---|---|
| Dimension | Ratio of energy | Ratio of time |
| Numerator | Actual energy generated | Generating hours |
| Denominator | Rating × clock hours | Clock hours |
| Lowered by | Shutdowns + reductions, power ascension, derated operation | Shutdowns only |
| Use | Economics, energy output | Equipment reliability |
Because UCF counts only losses within management control, it is used to compare plant operating performance; the capacity factor is used for energy sales and economics.
Key points at a glance
- Capacity factor: actual energy generated / (rated output × hours in the period) × 100 % — energy-based.
- Operating factor: generating (on-line) hours / clock hours in the period × 100 % — time-based.
- Relation: without output above rating, capacity factor ≤ operating factor; the gap comes from power ascension, end-of-cycle coastdown, load following and derated operation.
- International indicators: UCF = (REG − PEL − UEL)/REG; EAF also subtracts external losses (XEL).
- What lowers them: planned outages (refueling), unplanned trips, outage extensions, grid constraints.
- Improvement: longer cycles, optimized outage schedules, equipment reliability and predictive maintenance, human-error prevention, power uprates.
- Meaning: with nuclear's large fixed-cost share, capacity factor +1 percentage point → unit cost about −1 % (at 85 %).
- Classification: coastdown is XEL in PRIS but a planned loss in some schemes; dispatch reductions lower only the capacity factor.
- Calculation checks: keep the full clock hours in the capacity-factor denominator, use MWe (not MWt) in MWd, and check that the given energy is consistent with the operating days.